Introduction
The STM32CubeMonitor helps to fine-tune and diagnose STM32 applications at run-time by reading and visualizing their variables in real-time.
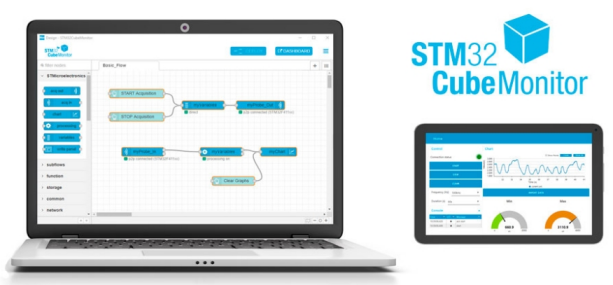
STM32CubeMonitor provides a flow-based graphical editor to build custom dashboards simply, and quickly add widgets such as gauges, bar graphs and plots.
With non-intrusive monitoring, STM32CubeMonitor preserves the real-time behavior of applications, and perfectly complements traditional debugging tools to perform application profiling.
With remote monitoring and native support for multi-format displays, STM32CubeMonitor enables users to monitor applications across a network,
test multiple devices simultaneously, and perform visualization on various host devices such as PCs, tablets, or mobile phones.
Moreover, with the direct support of the Node-RED® open community, STM32CubeMonitor allows an unlimited choice of extensions to address a wide diversity of application types.
Key Features
- Graphical flow-based editor with no programming needed to build dashboards
- Connects to any STM32 device via ST-LINK (SWD or JTAG protocols)
- Reads and writes variables on-the-fly from and to the RAM in real time while the target application is running
- Parses debugging information from the application executable file
- Direct acquisition mode or snapshot mode
- Trigger to focus on application behaviors of interest
- Enables to log data into a file and replay for exhaustive analysis
- Delivers customized visualization with configurable display windows (such as curves and boxes) and a large choice of widgets (such as gauges, bar graphs and plots)
- Multi-probe support to monitor multiple targets simultaneously
- Remote monitoring with native support of multi-format displays (PCs, tablets, mobile phones)
- Direct support of the Node-RED® open community
- Multi-OS support: Windows®, Linux® Ubuntu® and macOS®
LINKs
- Webinar – Application firmware monitoring with New STM32CubeMonitor is here
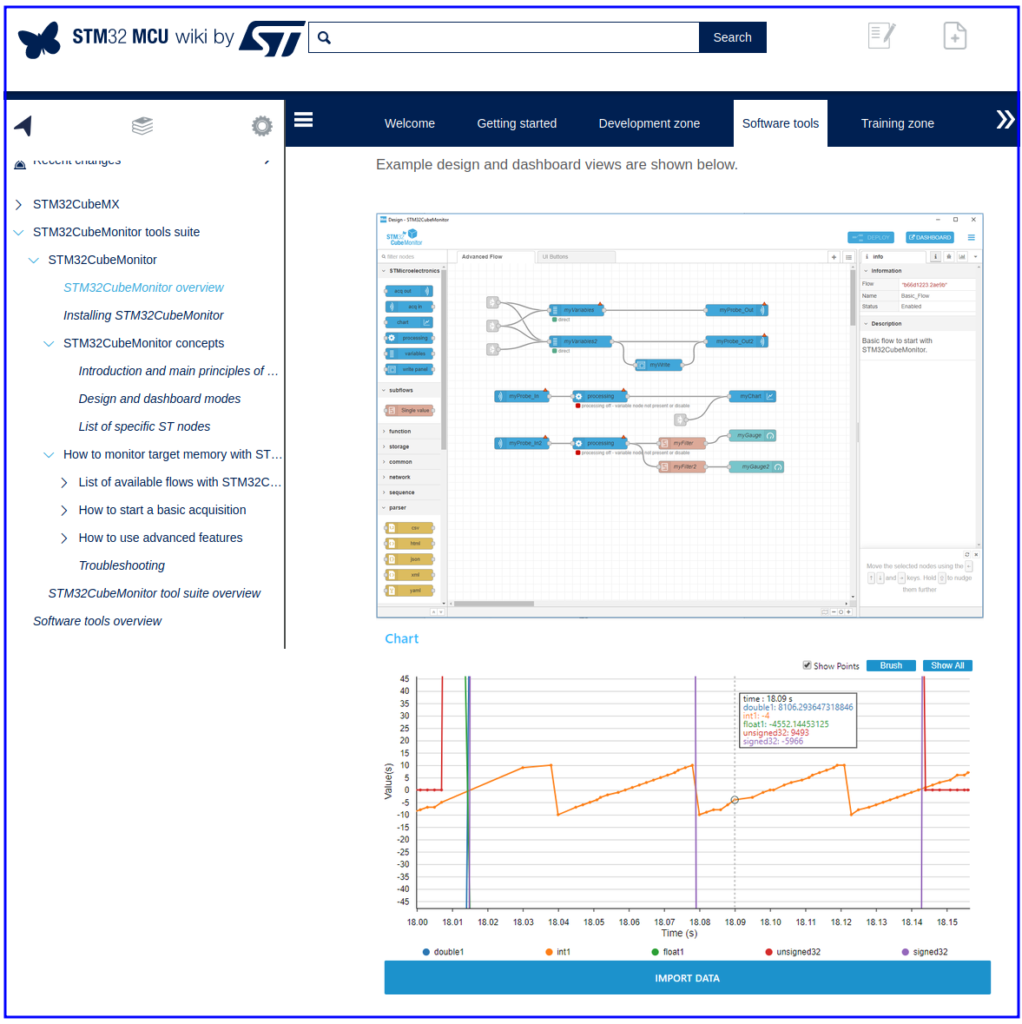
- The STM32CubeMonitor wiki is here, in wiki you can find: explanations, tutorials and examples, see the image below.

